Short Manual
2 Pages
Preview
Page 1
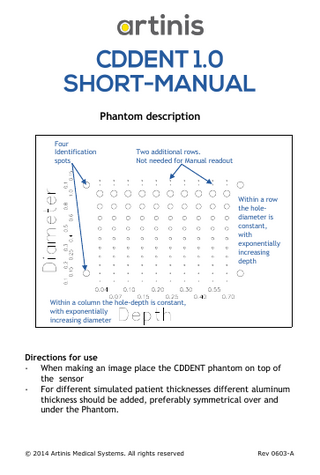
Phantom description Four Identification spots
Two additional rows. Not needed for Manual readout
Within a row the holediameter is constant, with exponentially increasing depth
Within a column the hole-depth is constant, with exponentially increasing diameter
Directions for use - When making an image place the CDDENT phantom on top of the sensor - For different simulated patient thicknesses different aluminum thickness should be added, preferably symmetrical over and under the Phantom.
© 2014 Artinis Medical Systems. All rights reserved
Rev 0603-A
For quality control purposes the following procedure is proposed: - See to it that your X-ray system is optimally adjusted. - Make phantom images of the optimal adjusted system and define the related CD-curve. The found CD-curve can be used as reference CD-curve. - Compare the CD-curves made as part of your quality control routines with the reference curve. The difference between the found CD-curve and the reference CD-curve provides information of the change in Image quality. - REMARK: of course phantom images should be made using the same exposure techniques as used when making the images for the reference curve. Evaluation of the phantom image The image should be evaluated in the area where the holes are just visible, by indication if a hole is visible or not. Preferably at least three images by at least three people. The results can be presented in a graph, in which the hole-depth is plotted against the holediameter. The curve through the threshold fields is called the Contrast-Detail curve. The better image will produce a CD curve in which smaller contrasts and details are visible. 1 CD-curve
0.9 0.8
Diameter
0.7 0.6
System 1 IQFinv = 14.6
0.5
System 2 IQFinv = 20.3
0.4 0.3 0.2 0.1 0 0
0.1
0.2
0.3
Depth
0.4
© 2014 Artinis Medical Systems. All rights reserved
0.5
0.6
0.7
Rev 0603-A